
Section 11 A Comparison of Classification Methods

We now compare the empirical (practical) performance of logistic regression, LDA, QDA, naive Bayes, and KNN. We generated data from six different scenarios, each of which involves a binary (two-class) classification problem.
In each of the six scenarios, there were p = 2 quantitative predictors. The scenarios were as follows:
Figure for Scenarios 1, 2, 3
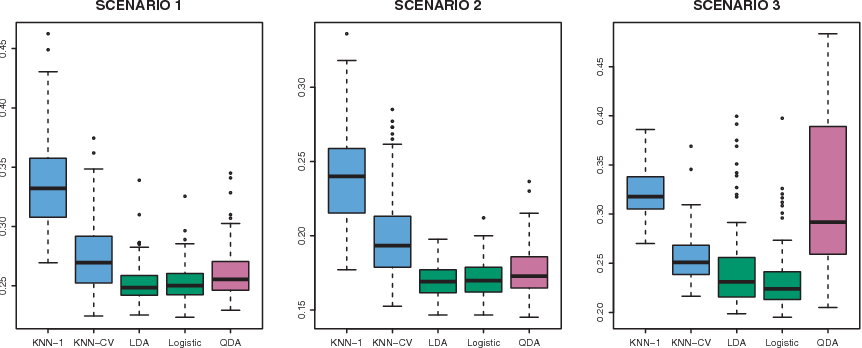
Figure 11.1: Boxplots of the test error rates for each of the linear scenarios described in the main text
11.1 Scenario 1
There were 20 training observations in each of two classes. The observations within each class were uncorrelated random normal variables with a different mean in each class.
The left-hand panel of Figure 12.1 shows that:
LDA performed well in this setting, as one would expect since this is the model assumed by LDA.
Logistic regression also performed quite well, since it assumes a linear decision boundary.
KNN performed poorly because it paid a price in terms of variance that was not offset by a reduction in bias.
QDA also performed worse than LDA, since it fit a more flexible classifier than necessary.
11.2 Scenario 2
Details are as in Scenario 1, except that within each class, the two predictors had a correlation of −0.5.
The center panel of Figure 12.1 indicates that the performance of most methods is similar to the previous scenario.
11.3 Scenario 3
As in the previous scenario, there is substantial negative correlation between the predictors within each class. However, this time we generated \(X_1\) and \(X_2\) from the t-distribution, with 50 observations per class. The t-distribution has a similar shape to the normal distribution, but it has a tendency to yield more extreme points—that is, more points that are far from the mean.
In this setting, the decision boundary was still linear, and so fit into the logistic regression framework. The set-up violated the assumptions of LDA, since the observations were not drawn from a normal distribution.
The right-hand panel of Figure 12.1 shows that: * Logistic regression outperformed LDA, though both methods were superior to the other approaches. * In particular, the QDA results deteriorated considerably as a consequence of non-normality.
Figure for Scenarios 4, 5, 6
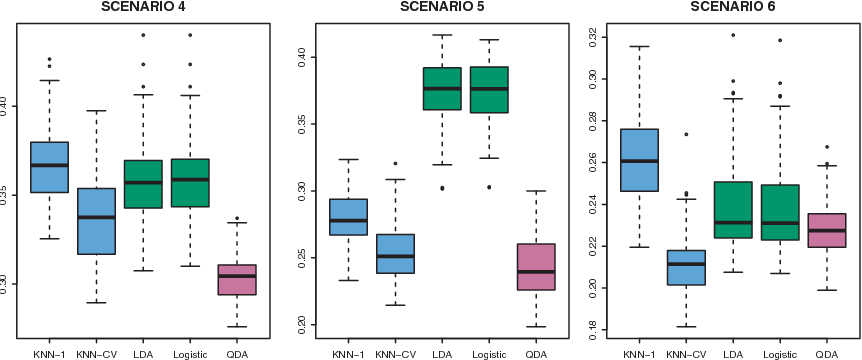
Figure 11.2: Boxplots of the test error rates for each of the linear scenarios described in the main text
11.4 Scenario 4
The data were generated from a normal distribution, with a correlation of 0.5 between the predictors in the first class, and correlation of −0.5 between the predictors in the second class.
This setup corresponded to the QDA assumption, and resulted in quadratic decision boundaries.
The left-hand panel of Figure 12.2 shows that QDA outperformed all of the other approaches.
11.5 Scenario 5
The data were generated from a normal distribution with uncorrelated predictors. Then the responses were sampled from the logistic function applied to a complicated non-linear function of the predictors.
Figure 11.3: Boxplots of the test error rates for each of the linear scenarios described in the main text
Consequently, there is a quadratic decision boundary.
The center panel or Figure 12.2 shows that the QDA once again outperformed best, followed closely by KNN-CV. The linear method had poor performance.
11.6 Scenario 6
The observations were generated from a normal distribution with a different diagonal covariance matrix for each class. However, the sample size was very small: just \(n = 6\) in each class.
Figure 11.4: Boxplots of the test error rates for each of the linear scenarios described in the main text
As the result, even the quaratic decision boundary was not a good fit.
The right hand panel of Figure 12.2 shows that:
QDA gave slightly better results than the linear methods.
Much more flexible KNN-CV method gave the best performance.
However, \(K\) = 1 gave the worst performance out of all methods. This highlight the fact that even when the data exhibit a complex non-linear relationship, a non-parametric method such as KNN can still give poor results if the level of smoothness is not chosen correctly.
Conclusion
These six examples illustrate that no one method will dominate the others in every situation:
When the true decision boundaries are linear, then the LDA and logistic regression approaches will tend to perform well.
When the boundaries are moderately non-linear, QDA may give better results.
Finally, for much more complicated decision boundaries, a non-parametric approach such as KNN can be superior. But the level of smoothness for a non-parametric approach must be chosen carefully.